BACK

Methods


The anthropological types illustrated on this site are derived from a qualitative analysis of many different anthropological studies, mainly written during the 20th century, mostly in German, English, French, Italian, Russian, Swedish, Hungarian, or Polish language. The classic anthropological typologies were in some cases similar to each other, but in others very different from one another. To derive the types illustrated on this site, type descriptions of different authors were compared, and if similar, several types were united into one, while if different, the original types were kept. To understand why this approach was chosen, what alternatives there are, how the classic 20th century studies identified their types, and how they relate to modern, often phylogenetic studies of the 21st century, a methodological overview is given here.

In most parts, this site gives priority to the integral approach. As colonisation and globalisation have quickly altered the anthropological compositions of many world regions, all maps and descriptions refer to the year 1500, before these processes started at large scale. Illustrating the current modern state of diversity would be conflicting as any type may appear anywhere in the world nowadays. Also, many mixed groups are not stabilised yet, e.g. members of the same family may be highly variable. Stabilisation usually takes a few centuries.

In the following, it is addressed where the anthropological type definitions come from, if they are clear biological divisions, or if they "fall from the sky" and are completely random, man-made, even political definitions. Eventually, the question is addressed "Why are phenotypes important?".

All information is the result of a private hobby project and is not based on any research funding. Although the site tries to be as accurate as possible, some results are speculative and may contain errors. If you find errors, please contact me.

1.) Numerical approach

The numerical approach analyses combinations of anthropometric traits on the individual level (in difference to the population approach). This methodology is also the foundation of the integral approach and the population approach, and was part of the analysis for most anthropologists. However, in difference to e.g. the integral approach, the numerical approach solely uses metrics to define a type. This has the advantage that no "human bias" alters the results, e.g. the subjective impression some phenotypes give to the human observer. Also, the data analysis is able to reveal relationships that are unobservable otherwise. Thus, the numerical types are a solely statistical result. The basic scheme of classification for European types is based on the numerical approach:

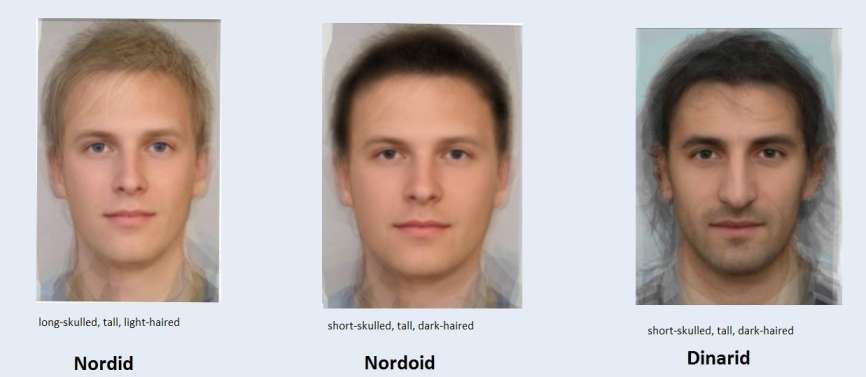
Table 1: Example for European types based on the numerical approach by a combination of three anthropometric traits (Lebzelter, 1929):

Type
skull (cephalic index)
height
(hair) pigmentation
Nordid
long
tall
fair
Nordoid
long
short to medium-tall
fair
Atlanto Mediterranid
long
tall
dark
Gracile Mediterranid
long
short to medium-tall
dark
Norid
broad
tall
fair
East Europid
broad
short to medium-tall
fair
Dinarid
broad
tall
dark
Alpinid
broad
short to medium-tall
dark

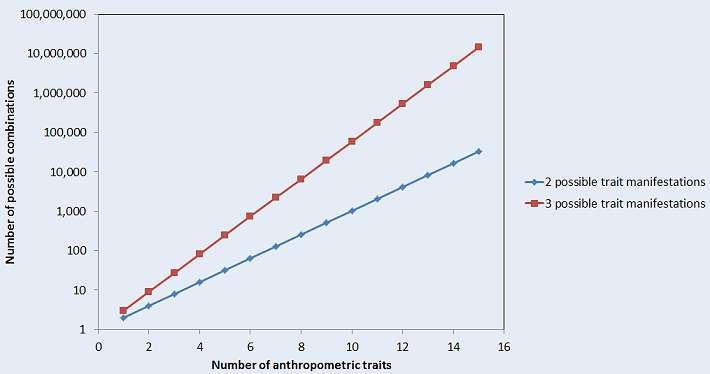
A cephalic index of at least 81 is considered short-headed, thus any tall, fair individual with a cephalic index of 80.9 would be classified as Nordid using this three-trait-based approach. With an index of 81 he would be Norid, ignoring other anthropometric features. The numerical approach was popular for example in the Polish and Yugoslav anthropology schools, which often used more than three metrics, but still only a limited number. Using numerical methods, sometimes Lappoid or South Mongoloid types were revealed among Native Americans or Australoid and Eskimoid types in Africa, even though these people have little relationship to Native Americans and Africans, respectively. This reveals a weak point of using an exclusively numerical approach: if only a handful of anthropometric traits is taken into account, huge differences in other features will not be considered and thus ignored. The numerical anthropologist is therefore highly dependent on his data and data quality. Also, with each metrical trait, the number of combinations quickly rises to huge numbers (see figure 1). Thus, a relatively small number of traits has to be selected. However, considering only 5 or 10 or even 50 anthropometric traits will not be sufficient to capture such a complex organism as a human, they can only capture a small fraction of a phenotype. Furthermore, measurement bias or different ways of measurement (e.g. there exist several methods to obtain the nasal index), or metrical traits altered by the environment will easily bias a classification. A human bias is also introduced easily by the choice of data acquired for the analysis. Thus, reasonable results with the numerical approach are only achieved with high data quality. Today, for instance, one could perform a 3D body scan and obtain thousands of anthropometric traits and add genetic info. This was not possible for classic anthropologists, and they didn't have the appropriate computers to handle such large amounts of data either. Either way, despite the drawbacks of the numerical approach, considering anthropometric features is helpful in any typological approach, one must only be cautious if no other information is considered.

Figure 1: Number of possible type combinations gives a specific number of anthropometric traits that have either two or three trait manifestations:

2.) Integral approach

The integral approach is the one favoured for the types illustrated on this site. Only if anthropologists using the integral approach had little information on a specific place in the world, types of other approaches were included for the region. Such approaches were common in the German, Italian, and French anthropology schools.

The integral approach is related to the numerical approach, or more precisely, builds upon it. It uses statistical combinations of anthropometric features (cf. table 1) too, but doesn't entirely rely on them. Instead, it adds a large amount of additional qualitative information. This includes a qualitative assessment of physical traits and how they appear to the eye of the human observer, especially features in human soft tissue that are difficult to measure. The integral approach also considers historical facts, e.g. about old migrations, the family history of the individual, and the environment a person lives in, because they may alter the phenotypes. It is also relevant if a type persists in families, social groups, or populations, e.g. is family-typical or village-typical. Only after taking all possible information into account, a classification is made. With so much information considered, the integral approach faces the same challenge as the numerical approach as the number of possible combinations quickly increases with each trait considered (see figure 1). However, the integral approach has a workaround in that it relaxes the sorting criteria. I.e. it defines a set of "ideal" types, but allows a small number of traits (e.g, two or three) to deviate. An example is shown below in figure 2. A tall brachycephalic, dark-haired individual can be Nord(o)id1 in the integral approach, even though two anthropometric traits deviate, if the other dozens of traits (and for example the family history) are typically Nordid. Such an individual would be classified as Dinarid in the strict numerical approach based on table 1 which uses three traits. Clearly the figure shows significant differences between Nordoid and Dinarid, even though they would be the same in the numerical approach example shown above. This is because three traits are usually too few to capture a human phenotype. Some might argue the individual in the middle of figure 2 approaches what many authors call Alpinid, but in the integral approach Alpinids are defined as short and stocky with a rounder forehead and weaker chin, smaller skull, shorter legs, wider nose, etc. Some might consider it mixed. The example illustrates how different typology approaches may come to different results in their classification due to differences of methodology. Also, for integral anthropologists, soft tissue usually played a relatively greater role (e.g. differentiating Mediterranids from Orientalids).


Figure 2: Dinarid or Nordid? (compare table 1)

For any defined set of ideal types (typology), individuals will group into three categories:

1.) Typical representatives of an ideal type, that show ~80-100% of the defined traits.

2.) "Mixed" individuals that match a (linear) combination of two or more types.

3.) Individuals that cannot be covered by the typology.

To find a set of types, an integral anthropologist for instance may try to maximise the number of individuals in group 1 and minimise the number of individuals in group 3. Ideally, a defined type should dominate in specific populations, social groups, or families, and be characteristic of them.

The integral approach faces several challenges. The great amount of information that needs to be considered can be too complex to find the set of possible types that best describes human diversity. Overall, the number of theoretically possible type definitions that could be included in the typology is almost infinite, although only few of the potential typologies will capture human diversity really well. Similar typologies of a similar value may exist that describe diversity, too. Thus, type definitions of integral approaches sometimes differ, especially in their details. Any typology is therefore more like a model, such as exist in most sciences as useful tools - as simplifications of reality that can never capture every detail of the real world. Also, the impression an individual may give to the human observer for qualitative evaluation may be biased, as such an evaluation depends on the skills, personality, motivation, and experiences of the observer. Another problem is that historical data and anthropometric measurements can contain errors. Nowadays it would be possible to partially substitute information from historical documents and tales (e.g. on old migrations) with genetic information, and have more and better anthropometric data. Such a genetically-extended integral typology could be developed by maximising group 1 and minimising group 3, once the data is collected. Alternatively, the number of variables could be reduced with principal component analysis and similar techniques. As classic anthropologists didn't have that information, it is possible that some of their types would be obsolete in a modern approach.

Overall, the integral approach is a very powerful tool to illustrate diversity. It was therefore chosen for this site. Unlike some classic anthropologists who promoted their findings as definite for various reasons, it is just regarded as a phenotypic model here.

3.) Population approach

The ambiguity problems of other typological approaches can be overcome by the population approach. This approach was particularly common in the second half of the 20th century, and typically utilised by the Russian anthropology school, but also some French, German, and other researchers. Instead of looking at individuals, the population approach looks at average metrics of population complexes or language groups. These groups may contain a wide range of phenotypes. The clear advantage of the population approach is that populations or language groups can often be clearly defined, hence there is a unique, clear solution. Also, its applicability is very high. A lot of different metrics can be included, and no restrictions exist for the resulting type system like in the two approaches illustrated above. Theoretically, each population complex is clearly recognisable even if 1000 anthropometric traits are assessed. Early computers of the 20th century were able to handle the averaged population metrics much more easily than individual datasets. Thus, it added many new findings to the research. The resulting population complexes, e.g. Baltic, West Baltic, etc. are usually not identical to the types of other approaches, although they may be similar. Usually there are several types within each population complex. Figure 3 gives an example. The top row shows local varieties identified by the integral approach, the second row shows examples of population complexes these types could form.

Figure 3: Relationship of population complexes and anthropological types of the integral approach:

Figure 3 also reveals one disadvantage of the population approach: all three illustrated complexes look similar. This is because, as the diversity of phenotypes within a population is aggregated, a lot of information can be lost. Populations may be diverse, social groups or ancestral groups within a population may significantly differ, and this is not always known to the investigator. A certain social group may look more similar to people of another region than to their cohabitant social groups. Taking only the mean and variance of several metrics across populations will possibly drop a great amount of information available only at the individual level. As an example, figure 4 shows the estimated probability density function of one anthropometric trait, male height, for a place in North Scandinavia that is inhabited by Nordid and Lappid individuals. Nordids on average tend to be significantly taller than Lappids. Thus, the function has two peaks. Similar phenomena are found for many places in the world and many different anthropometric traits. This information cannot be captured by population complex if the different groups within a population are not separated. This is especially disadvantageous in very diverse countries like India, where the caste system produced a great variety of looks.

Figure 4: Probability density function of estimated male height for a place with Nordids and Lappids in North Scandinavia:
For the reasons illustrated, the population approach is usually not considered for humanphenotypes, except for some regions where researchers applying this method had much better knowledge than researchers who used the numerical or integral approach (e.g. in Siberia). The population approach however remains the most robust method in a practical sense.

4.) Race as a social construct

Another approach that is very common today is to define anthropological groups or "races" as a social construct. It has little to do with the three approaches illustrated above and even less with phylogenetic relationships. Classification criteria differ from country to country and change by time. An individual regarded as "Black" in the United States may not be seen as Black in other parts of the world, the person may be regarded as "White" in Uganda or even Australia. In the social construct approach, the classification of individuals often relates to the history of the country. Typical examples are the "one drop rules". E.g. if an American has 1/8 African ancestry, he will be classified as African-American, even though he may phenotypically and genetically be mostly European. Conversely, an individual with 1/8 European ancestry will not be regarded as "White" or "European" in this system. How a person behaves, where he grew up and how he identifies plays a great role as well. Some individuals may have a background where they are able to choose their "race", while individuals with another background may not. This approach has also been applied for Native Americans in the USA or Native Australians or even Ainu in Japan. Another characteristic of the social construct approach is an overemphasis on a sole anthropometric trait, often skin color. E.g. Sudanids. Ethiopids, Indo Melanids, Negritids, and Australids may all be summarised simply as "Black", even though they differ greatly genetically, historically, and even anthropometrically. They just share at least one common anthropometric trait. An equivalent would be to group all broad-faced people into one "race" (which has never been done). In some cases political ideologies play a great role in the social construct approach, some decades ago similar methods in anti-Semitic countries of Europe were used to identify Jews. The social construct approach is not employed on this site, because it cannot describe human biological diversity in a scientific way.

5.) Phylogenetic approach

A very powerful scientific approach for investigating human diversity is the phylogenetic approach. Instead of considering phenotypical and anthropometric traits, it studies the genetic composition of individuals, often based on molecular sequencing data. The term phylogenetics derives from the Greek terms phylé and phylon, denoting "tribe", "clan", "race". With the advances in genetic methods during the late 20th and early 21st century, this approach became a common method to investigate human biological diversity, although 100 years ago phylogenetic trees already existed that shared similarities with modern trees. Generally, a diversity of genetic traits is assessed and then aggregated to principal components or similar factors by statistical analysis. The phylogenetic approach is the best to study ancient migrations, the time at which human populations diverged, and the extent to which they mixed. However, it faces similar statistical challenges as the numerical approach when it comes to data comparability and quality. In most cases the genetic information collected will only describe a fraction of a whole biological organism, data may contain errors, and measurement methods are not always comparable. This can produce biased results, because the complex organism is not fully considered, and many unobserved characteristics and genes are ignored. Also, the applied statistical techniques have limitations and specific data requirements that cannot always be satisfied. Another weakness is that the phylogenetic approach doesn't account for phenotypic differences (see below). However, despite these weaknesses, the usability of the phylogenetic approach to study ancient human migrations remains great. Figure 5 shows a strongly simplified phylogenetic tree of modern humans.

Figure 5: Simplified human phylogenetic tree for selected anthropological types according to current research:
The phylogenetic tree shows the common ancestor of Homo sapiens and Neanderthals, who lived around half a million years ago in Africa. Neanderthals, who left Africa several hundred thousand years before Homo sapiens, adapted to the cool ice age climate of Europe and Asia by developing thickset bodies, very large noses, and lighter skin. Homo sapiens started to diverge into its modern varieties about 150,000 BCE in Africa. Early Homo sapiens probably lived in dry tropical climate in Africa (during the ice age tropics were less humid than today). Thus, noses were probably only moderately broad (see relationship between nasal width and humidity) and skin was probably (dark) brown. Khoisan diverged first from all other humans. The common ancestor of all non-Khoisan groups developed different varieties: Proto Sudanids, Proto Nilotids, and Proto Ethiopids. The latter group started to migrate out of Africa some 60,000 years ago and interbred with Neanderthals and possibly other humans like Denisovans. As humans migrated North, their skin began to turn fairer, often reaching a light or medium brown tone. Phenotypes quickly started to change under the new circumstances due to adaptive pressure, natural selection, and cultural changes the new conditions brought. North East Asians adapted to continental climate with icy-cold winters, Europeans to agricultural life in cloudy temperate climate. Both adaptions brought modest to strong depigmentation, narrower noses, and shorter limbs. Some groups migrated across South Asia to Australia and Melanesia (e.g. ancestors of Bukaids). Although Bukaids are genetically closer to Europeans and East Asians, they look relatively similar to Bantuids and many other sub-Saharan Africans, because of their adaption to a similar, humid and tropical climate. Figure 5 shows that under relatively constant conditions in prehistoric Africa, phenotypes changed at a moderate speed only, while they were quickly altered under the various new circumstances outside of Africa.

At least two different processes drive human diversity: genetic divergence and phenotypic divergence. The main driver of genetic divergence is stochastic genetic mutations that occur over time, while the main driver of phenotypic divergence is adaptive pressure in new environments, culture, and the resulting processes of natural selection. Separated populations under similar circumstances will remain similar for a long time, because of similar adaptive pressure and possibly even convergent evolution. For the differences among humans both processes are important. This is illustrated below.

Why are phenotypes important?

In the previous section it was shown that the phylogenetic approach is very useful to study human migrations and genetic divergence. However, differences in humans are not only driven by genetic divergence, but also by phenotypic divergence caused by adaptive pressure. In evolution, a new species can be produced by either process, in most cases by a combination of both. If there is no phenotypic divergence, but a long process of genetic divergence, different populations will develop too many genetic differences to continue producing viable offspring, and develop into new species. If there is no genetic divergence, but a strong natural selection and adaptive pressure for one or both of the populations, their anatomy will become so different that they stop interbreeding as well. Prior to speciation, different subspecies or "races" usually develop. There is no uniform definition from what point on different phenotypes and/or genotypes may be regarded as different subspecies. This is illustrated by the "gray zone" in figure 6 that depicts the two processes (for a much more detailed description on phenotypic vs. genetic divergence in evolution, see for example Winker, 2009).


Figure 6: Phenotypic and genetic divergence:

To illustrate both processes, it is possible to draw some pairs of phenotypes from figure 5 into figure 6:

Figure 7: Phenotypic and genetic divergence for selected type-pairs from figure 5:

Figure 7 illustrates phenotypic and genetic divergence for three types from figure 5: Nordid, Bukaid, and Neanderthals. Between Neanderthals and Nordid, genetic as well as phenotypic divergences are relatively great, some researchers regard Neanderthals as a different species. Between Nordid and Bukaid, phenotypic differences are smaller than to Neanderthals, but Nordid-Bukaid differences can easily be recognised in many anthropometric traits, both show a completely different adaption. However, the two types probably only split some 40,000-60,000 years ago, which is relatively late in evolutionary dimensions. The split between Bantuids and Bukaids occurred earlier (see figure 5), but still both types resemble each other. This is because both live in a relatively similar climate and adaptive pressures have been similar. Thus, although genetic differences between Bukaid and Bantuid are greater, the phenotypic difference is only small.

To conclude, phenotypic as well as genetic differences account for human diversity. Human diversity may be relevant for health, nutrition, society, sports, and skills. The current research adds much information about genetic differences, but little about phenotypic differences. During most of the Paleolithic however, when the main modern branches of Homo sapiens diverged, humans were closely connected to the climate and nature they lived in, their phenotypes are a mirror of their environment. Thus, humanphenotypes tries to close this gap in providing a typological model that summarises the available information on phenotypic differences among humans. The data and types were mostly studied during the 20th century.

1 "Nordoid" means "Nordid in the wider sense" / "slightly modified Nordid", Nordiform would mean unrelated to Nordid and not part of it, but showing similar phenotypical features